Indices

Laurels for Credit Rating Agencies:Levers of Change in the Climate Adaptation Market

The voices and actions of the financial industry are critical to change capital market policy and practice change. That’s why I’m thrilled credit rating agencies are seizing their role as levers of change in the adaptation market. Consider these three examples of their newfound interest:

  1. Standard & Poor’s explicitly weighs adaptation in its new Proposed Green Bond evaluation tool.

  2. S&P proposes an Environmental Social and Governance risk exposure assessment.

  3. In its proposed ESG assessment tool, S&P acknowledges the differences in the time horizon of risk

Read my oped published in Triple Pundit for more insights: http://www.triplepundit.com/2016/10/laurels-credit-raters-levers-change-climate-adaptation-market/

What’s Your Climate Resilience Moon Shot?

At a recent “Challenges and Opportunities of Private Sector Climate Resilience” conference convened by the Multilateral Investment Fund of the Interamerican Development Bank in Cartagena, Colombia, I moderated a panel of three of the world’s resilience experts and posed this clinching question: What is your resilience moon shot.

Their answers proved to be as diverse as their backgrounds – and the rest of us better be ready to implement them:

·      Emilie Mazzacurati, founder and CEO of the award-winning Four Twenty Seven climate consultancy (one of two firms worldwide exclusively adaptation-focused), responded in keeping with her leading-edge analysis, research and strategy work. Her resilience moon shot? A climate adaptation unit. “We need a measure of resilience that allows the market to see progress over time,” she maintained.

·      Eric Kaufman, indefatigable head of the Natural Resilience Foundation to establish financing mechanisms for public resilience projects such as Staten Island’s New York Wheel project, offered: densification of Orlando with all of Southern Florida’s residents safely located on higher ground and the rest of the land-turned-to-sea becoming a glorious water park.

·      Dale Sands, senior vice president and Global Director, Metro and Adaptation Services for engineering giant AECOM and lead of such game-changing projects as the UN Disaster Reduction Department (UNISDR), favors a risk-sharing mechanism for small businesses. It would be based on insights gleaned from AECOM’s survey of 208 New Orleans small businesses. 

I will reveal my climate adaptation moon shot as I launch Climate Resilience, a consulting firm helping corporate and local government leaders to incorporate climate adaptation into their value chains. 

What’s your resilience moon shot?

Buffering Against Climate Risk: Lessons for the Refugee Crisis

This blog was initially published by our partner, the RANE network:  https://www.ranenetwork.com/rane-blog/buffering-against-climate-risk-lessons-for-the-refugee-crisis/ As the world watches countless economic migrants and war refugees journey perilously from their volatile homelands to relatively stable countries that respond with tactics as varied as their histories, two overarching questions arise: How did we arrive at this stage of human suffering? And what can we do to avoid it from occurring again?

I think it is worth examining why some countries withstand stress while others don’t. In my work with the Notre Dame Global Adaptation Index, I focus on how countries adapt to the stresses and shocks of climate change. I think there are valuable lessons from this examination of climate risks to help explain why some countries are buffered from creating refuges when times get tough.

In ND-GAIN’s country index, we identify those countries that have significantly improved their economic, social or governance components (which we examine as a way to understand a country’s readiness to take on adaptation investment) and have decreased their climate vulnerability over the past two decades

There is a unique set of 10 countries who have decreased their vulnerability and increased their readiness more over the last 20 years.

While this set of countries seem more diverse than similar – different locations, government type, history and economic systems, these countries share common features, and one in particular stands out from the 46 indicators ND-GAIN examines: political stability. It turns out that the stability afforded by good governance in the form of political stability may buffering them from stress turning to crisis in the case of both climate risk and emigration.

It is interesting to examine the diversity in these countries’ approach to gaining political stability. The countries can be categorized into three groups: those who improved, those who worsened but then rebuilt and those who remained mostly unchanged.

In the first group are Rwanda, Angola, Georgia and Turkey. Each has improved its political stability since 1995. Rwanda and Angola, for instance, have made significant peacekeeping strides from their violent past of civil wars and genocides. Human rights have improved there, too.

The group of countries whose political stability worsened but then rebounded includes Saudi Arabia, Belarus and Oman. Saudi Arabia’s leader suffered a stroke, which led to an odd period of leadership. The war in Iraq and al-Qaeda’s presence in the region also affected it and led to decreased political stability. Since, however, the Saudi government has retained some of its lost political stability, which helps it prepare for climate change.

Oman also suffered from events in Iraq but made great progress since in its elections and freedoms. Belarus, which gained independence in 1991 from the Soviet Union but then endured abusive authoritarian rule, regained political stability after its people protested.

Those countries that remained mostly politically stable in the past 20 years include Uruguay, Mauritius and the United Arab Emirates. While they experienced quite a bit of change during this period, they dealt with it within their current political system, and this has led to their success in climate change preparedness.

As Rockefeller Foundation President Judith Rodin notes, “… it’s what doesn’t happen that proves success. When disruptions do not become disasters, we’ve won. When a community is resilient and stays strong in the face of a crisis, (we) mark a victory.”

These 10 countries, then, may well hold lessons to today’s heart-breaking emigration from Syria and elsewhere. In the 10, we see political stability as a buffer to the shocks and stresses of climate change — and perhaps as well to the tragedy of exodus from them.


Countries whose vulnerability to climate change, other global challenges decreased while readiness to improve resilience improved. (Top 10 out of 182)

Country ND-GAIN Country Index Score Improvement 1995-2013
United Arab Emirates 16.06
Saudi Arabia 13.98
Turkey 12.56
Rwanda 12.24
Oman 12.04
Georgia 11.23
Mauritius 11.11
Angola 10.85
Uruguay 10.65
Belarus 10.56


Joyce Coffee is managing director of the Notre Dame Global Adaptation Index (ND-GAIN). 
Urban Adaptation Questions To Explore, with thanks to Joann Carmin

Attending the Carmin Symposium on Urban Climate Adaptation last month, I had the pleasure of being reminded over and over again why experts the world over looked to Dr. Carmin for insights and guidance to galvanize urban adaptation.

Here are five questions her closest collaborators elucidated for us, some of which ND-GAIN will be exploring via our Kresge Foundation-funded urban adaptation assessment project.  Which of these questions are you finding answers to? :

What internal and external factor shape the ways in which poor and marginalized urban residents can participate meaningfully in planning and action for urban resilience?

What are the characteristics of urban agents, systems, and institutions that make them more resilient in the face of climate change?

In what ways can local governments influence national legislative and policy frameworks to create an enabling environment for urban adaptation?

How can cities engage in a meaningful way in global policy to shape the conditions in which they will need to respond for climate change?

Innovation ->  implementation -> institutionalization

Index Inquisition, Incursions, Insides, Insights

Earlier this month, the Economist warned about the vagaries of Index.  I’ve written about this, too.  And I agree we must be careful about reading too much into Index.  But, as a journalist who interviewed me recently pointed out, “Journalists love them,” and in the Economist’s case, that seems to be true. Following on its November 8 article, the Economist’s next issue carried an article on sexual harassment in Canada and referenced the World Economic Forum’s rankings of countries by gender inequality. In yet another article about growing globalization, the author cited the DHL Global Connectedness Index.  I’m an eager consumer of the Economist and, in each issue, I run across about two index references (not to mention the favorite worldwide index:  The Economists’ Own Big Mac index).

I’m proud to say that ND-GAIN gets it right, according to the Economists’ 1, 2, 3 guide to better international country rankings: We don’t tweak the weightings to suit, don’t substitute data when a country is lacking it, and use only data globally available, national in scope and verifiable. We publish our full methodology (and all of our data and framework too) free and open to the public.  We raise caveats and describe our choices in this document.  We agonized for 18 months over what to put in our index and sought our indicators from the literature and from experts in the field.

With ND-GAIN, we are eager to catch people’s attention and make information easy to process.  The Economist notes that “ratings and rankings can be powerful tools of both branding and influence.” They can help shape new policy.

We’ve just released the 2014 version of the Index and have made improvements, such as opting for

  • Consistent terminology in vulnerability sectors so that a single definition of exposure, sensitivity and adaptive capacity applies across all sectors.
  • Distinction among sectors and vulnerability components to minimize conceptual overlap within the Index; e.g., the combination of energy and coastal infrastructure under a single infrastructure sector.
  • More flexibility for downscaling portions of the Index to allow integration with Geographic Information Systems.
  • Equal weighting between all sectors (vulnerability) and components (readiness).
  • Responsive to user feedback in adjustments to indicators of economic readiness.

We’ve also made it easier for those Economist journalists (and others!) to use:

ND-GAIN’s web-portal. It now includes new computational tools to facilitate ease of use, to allow more data visualization and to enable tracking individual indicators and country grouping, including the:

  • Ability to visualize each indicator, sector and area on line graphs and spider graphs.
  • Ability to graphically compare indicators, sectors and areas of two nations or groups of nations.

Capability to download all indicators, sector scores, and ND-GAIN scores.

Measuring Country Resilience

For the past several months, my colleagues and I have heard a lot more about both adaptation and resilience*, especially in discussions with ND-GAIN’s corporate users.  This guest blog, by ND Global Adaptation Index's Chen Chen, offers insights into resiliency particularly in the Association of South East Asian Nations. To measure countries’ resilience to rebound from adverse impacts of climate change, ND-GAIN focuses on the adaptive capacities of five sectors that provide communities with life-supporting assets and social services:
  • Food
  • Water
  • Public health
  • Ecosystem service
  • Human habitat.

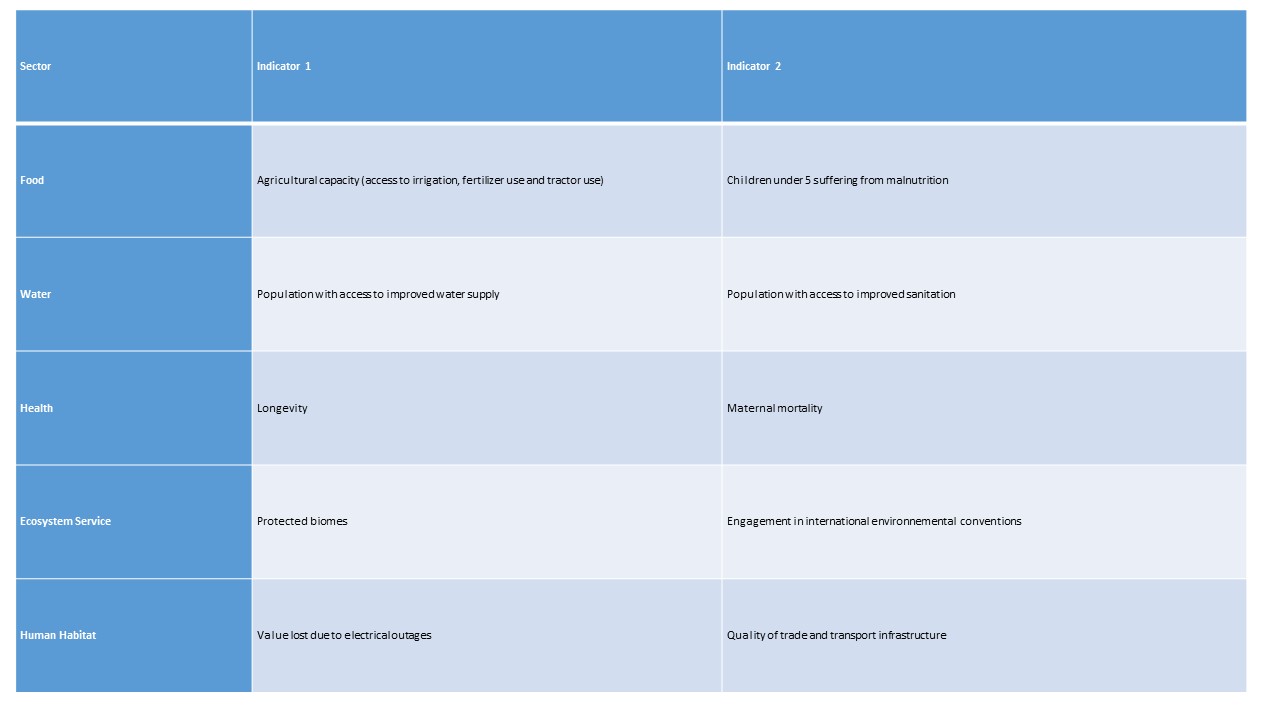
Chosen indicators reflect capacities that make social systems persist in a changing climate, based on historical data that scores countries’ performance in each of the five sectors. For instance, in the food sector, countries with a high rate of child malnutrition will possess low resiliency if climate-induced events strike the food-production system. In the ecosystem service system, countries’ engagement in international environmental conventions, such as the International Plant Protection Convention, shows a political willingness to commit to sustainable development and a technical capacity to take actions to ensure the proper functioning of ecosystems. Table 1 illustrates the set of indicators ND-GAIN uses to measure resiliency within these sectors:

Table 1 Indicators of Adaptive Capacity Measuring Resiliency to Climate Change


ND-GAIN analysis over the last 17 years finds that when these indicators are analyzed for 177 countries, lower-income countries will require a century to reach the level of resiliency of OECD (generally upper-income) countries.

ND-GAIN data also helps examine regional resiliency.  For instance, ASEAN has been improving its resiliency to climate change over time from 1995 to 2012. In particular, it has made rapid progress in enhancing resiliency in water and health sectors by strengthening capacities to provide quality services in these areas. See Figure 1.

Standardized scores over time (0 indicates lowest resiliency and 1 indicates highest) for resiliency sectors in Association of Southeast Asian Nations (ASEAN).

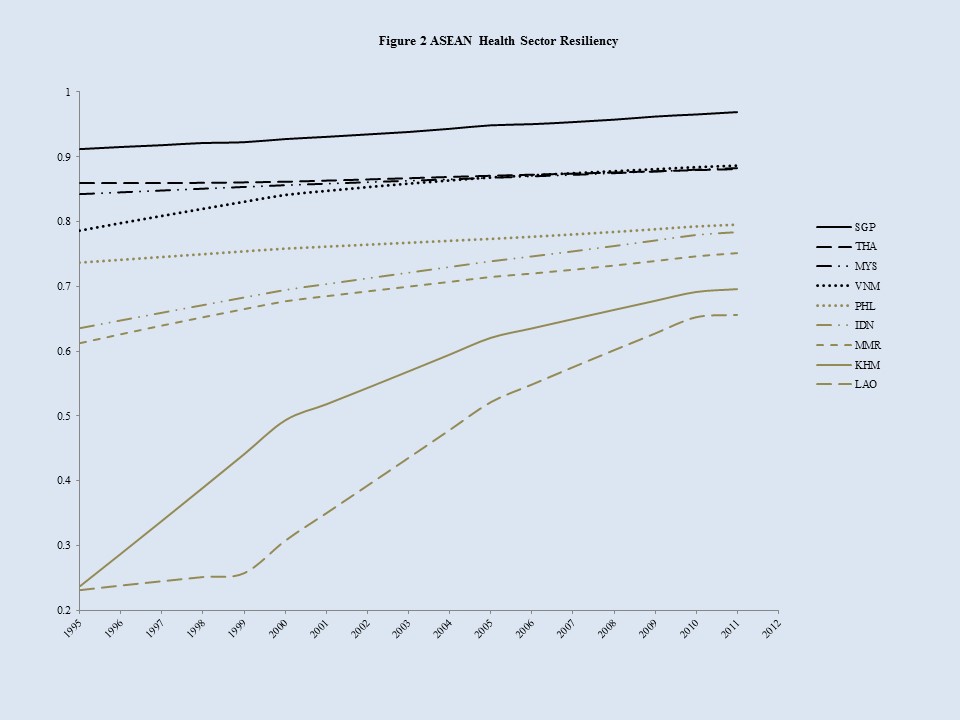
Each country’s performance contributes to the trend of increasing resiliency. As illustrated in Figure 2 and considering the health sector, Singapore posts the highest resiliency and continues that strength, while Cambodia and Laos have show more improvement, relatively. In particular, Cambodia displays the highest rate of progress among nine ASEAN countries, contributing greatly to ASEAN’s overall health-sector resiliency improvement. Still, Cambodia and Laos, perhaps, will  require decades at current rates to reach to the current level of resiliency in Singapore.


By analyzing our data to better understand resilience, ND-GAIN helps decision makers inform their supply chain, capital asset, community engagement and policy decisions with the future of lower-income countries in mind.

*Resilience: The capacity to recover quickly from difficulties (Oxford Dictionary)


Poor Countries Are Losing Ground in the Race to Adapt to a Changing Climate

The World Economic Forum released their 2014 Global Risk Report with a write up crafted by WEF’s Global Agenda Council on Climate Change based, where Juan Jose Daboub (the Global Adaptation Institute’s founding CEO) is co-chair.  I drafted the original write up which resulted in this piece: The year 2014 is likely to be crucial for addressing climate risks, a point made by United Nations (UN) climate chief Christiana Figueres at the Warsaw Climate Change Conference. Countries made only limited progress on issues such as emissions reduction, loss and damage compensation, and adaptation. Greater progress is urgently needed to create incentives and mechanisms to finance action against climate change while efforts are made to keep temperature rise below 2 degrees Celsius.

Even as governments and corporations are called upon to speed up greenhouse gas reduction, it is clear that the race is on not only to mitigate climate change but also to adapt. Droughts, super-storms and other natural disasters are increasingly causing systemic risks around the world.

Failure to adapt most strongly affects the most vulnerable, especially those in the least developed countries. They tend to lack the infrastructure and capacity to deal with extreme droughts and floods, reduced crop yields and increased stresses on energy and water supplies.

According to the latest Notre Dame-Global Adaptation Index, it will take more than 100 years for the world’s poorest countries to reach the current adaptive capacity of higher-income OECD countries. The World Bank estimates the cost of climate change adaptation for developing countries at US$ 70-100 billion per year through to 2050.

Gradually, however, promising models are emerging of collaboration between the public and private sectors and civil society to strengthen resilience to climate change. An example is the US$ 3 billion Southern Agricultural Growth Corridor of Tanzania (SAGCOT), intended to create the infrastructure to nurture new value chains. Through techniques such as rainwater harvesting, efficient irrigation and crops that can produce more nutrients for the same input of water, SAGCOT aims to increase food production in a way that is both environmentally sustainable and benefits small-scale farmers and the rural poor.

Such innovative and ambitious projects, unlocking investment funds through public-private partnership, showcase the kind of multistakeholder collaboration that will be needed across all sectors to meet the twin priorities of climate change mitigation and adaptation.

Sources

ND-Global Adaptation Index http://news.gain.org/post/69787249752/2013-nd-gain-data-show-worlds-poorest-countries-lag

Scherr, S. J., J. C. Milder, L. E. Buck, A. K. Hart, and S. A. Shames. 2013. A vision for Agriculture Green Growth in the Southern Agricultural Growth Corridor of Tanzania (SAGCOT): Overview. Dar es Salaam: SAGCOT Centre. Available at http://www.ecoagriculture.org/documents/files/doc_483.pdf

World Bank. 2010. Economics of Adaptation to Climate Change: Synthesis Report, Washington DC: World Bank. Available at http://climatechange.worldbank.org/sites/default/files/documents/EACCSynthesisReport.pdf


National Security: A driver for climate adaptation prioritization?

I got involved in the corporate sustainability space through civil conflict. In Vietnam, actually, while investigating innovations in water infrastructure service delivery sparked by a community fight over access to water in Haiphong. That escalated into a major conflict that left two water workers dead before the People’s Committee came to its senses and considered a new way to approach fair water access. That was two decades ago. Yet that question of water and conflict continues to erupt and spill over from small-town skirmishes to all-out wars.  Noted journalist Tom Friedman has written about it in an April 2012 column, The Other Arab Spring, and a May 7, 2013, column, Postcard from Yemen. And I’m hearing rumblings from my Notre Dame colleagues who suggest a rear-view mirror look at Darfur reveals that the conflict that forced people off their land was less about sectarian strife and more about lack of access to water. My colleague Peter Annin has written a book with the provocative title of “Water Wars.”

When I think about water conflict, though, I ask myself if we know more now than we did about the relative vulnerability to water risk. It turns out that we do know a lot more.  For instance, examining countries on a short fuse in water-stressed regions of the world through the ND-GAIN index, it’s apparent that the Sahel and the Horn of Africa both show significant water vulnerability. Indicating that are such barometers as the projected change in precipitation and percent of population with access to improved water supply. Their vulnerability could possibly be having an impact on other  susceptibilities, such as food and health and wellness.

It is plausible that climate change is causing internal and cross-boundary migration that is affecting security around the world. At the recent New York Climate Week, Brigadier General Steven Cheney, CEO of the American Security Project, noted that 70 percent of global militaries consider climate change a threat to security.  He identified regions such as S. Asia Bangladesh, India and Pakistan, Mali and the Middle East as “tinder boxes” for various  reasons that concern flooding and drought, which are triggering competition for resources.


The U.S. military is taking a close look at this. A 2011 Defense Department Report,  “Trends and Implications of Climate Change for National and International Security,” firmly recommends to “institute water security as  a core element of DOD strategy” since “the availability of water underlies all other elements of human security.”

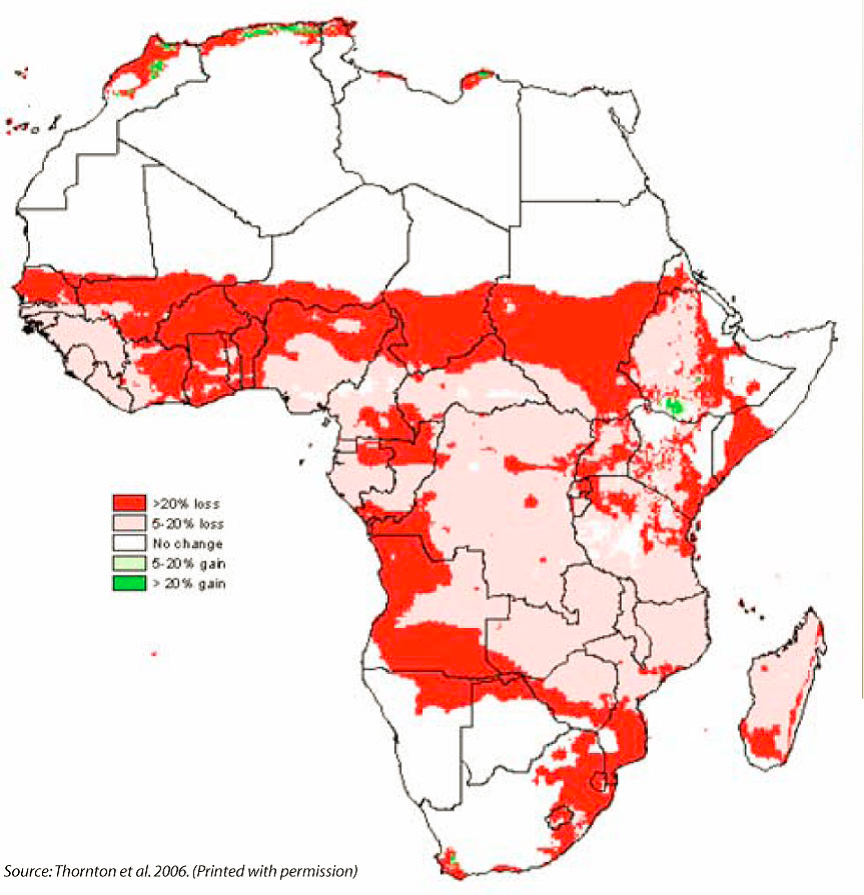
Percent changes in length of growing period changes to 2050.


So what  specifically do you analyze and consider to determine if a war or significant conflict is caused by climate change?   One approach involves looking at countries that are less vulnerable, or that have become less vulnerable over time, than their neighbors or peers and measure the degree of conflict in them.  In Africa, according to ND-GAIN, countries like Tanzania and Zambia have become less vulnerable over time.

The upshot? Investing in adaptation could be one way to mitigate civil conflict.

Post Script October 23. 2013.  Thanks to Josh Foster - a wiki of all things climate adaptation - for sharing the following with me from Science:

QUANTIFYING THE INFLUENCE OF CLIMATE ON HUMAN CONFLICT

A rapidly growing body of research examines whether human conflict can be affected by climatic changes. Drawing from archaeology, criminology, economics, geography, history, political science, and psychology, we assemble and analyze the 60 most rigorous quantitative studies and document, for the first time, a striking convergence of results. We find strong causal evidence linking climatic events to human conflict across a range of spatial and temporal scales and across all major regions of the world. The magnitude of climate’s influence is substantial: for each one standard deviation (1σ) change in climate toward warmer temperatures or more extreme rainfall, median estimates indicate that the frequency of interpersonal violence rises 4% and the frequency of intergroup conflict rises 14%. Because locations throughout the inhabited world are expected to warm 2σ to 4σ by 2050, amplified rates of human conflict could represent a large and critical impact of anthropogenic climate change.

Science 13 September 2013: Vol. 341 no. 6151 1235367


Ranking Country Sustainability for Investor Decisions

As we know, decision–makers rarely if ever look at climate risk in isolation, which is why I’m glad that Marc Klugmann brought another great article from Fast Company’s Ben Shiller to my attention.  Mark is a founding strategic advisor to GAIN, and thus he is on the lookout for other indices that rank country vulnerability. RobecoSAM offers us a good one and a reminder of the importance of looking at a chromatic list of indicators when making sustainability decisions.

The article,The 59 Countries That Are Most Prepared To Handle An Uncertain Future is particularly interesting to us at ND-Global Adaptation Index, where we are currently pouring over 2012 data in preparation for launching the 2013 index in December. Comparing their index to ND-GAIN’s 2011 data we see that there is a great deal of consistency.  For instance eight out of ND-GAIN’s top-ten are in their top ten (The difference ND-GAIN includes New Zealand and Ireland in our top ten, not Canada and US).

ND-GAIN – which includes measures of governance, economics and society along with health, infrastructure,water, etc. and RobecoSAM’s sustainability data are complimentary and help corporations, governments, and charitable organizations prioritize investments in:

  • New Markets, Products & Services
  • Targeted Development
  • Risk Mitigation
  • Corporate Social Responsibility

Ultimately, indices like these help address crucial investor questions, such as:

  1. Are you solving a big problem, preferably one that is worth a lot of money and is recognized today?
  2. Is your solution differentiated, compelling and sustainable?
  3. Does your venture have an understandable and relevant business model given your solution and the problem it addresses?

Stay tuned for a blog post next week that digs into some of these questions from the perspective of adaptation risk.


Top Three Reasons to Love Your Index

The top three reasons to use an index

Some of you will disagree with the title immediately.   Indices, among other complaints, are prone to lack transparency, magnify errors, misrepresent details…and you get the message.

But you may realize how frequently indices enter into your decision-making.  A recent staff meeting of ours uncovered three major ones used today: NASDAQ for our investments, U.S. News and World Report college rankings for our kids and the Big Mac Index to settle a bet.

Much as we love to critique (and criticize) indices, they do have their place. Please read through my top three reasons for using an index; then tell me what you agree – and disagree – with.

  1. Indexes have readily available relative information that sparks dialogues and invites further investigations.

  2. Indexes often invite new audiences to a concept that differs from their area of interest because they combine different variables rather than looking at them in isolation.

  3. Indexes provide measures for change that, otherwise, are not quantifiable with a numeric indicator.

The most satisfying indexes allow those who use them to control variables and scenario analysis that visualize the effects of each index component.  This is what turns them from conversation starters to decision-making tools.

For adaptation indexes, I’ll possess the disadvantages while still celebrating the ability to start a conversation about results leaders who take steps toward resiliency often obtain.  I’m particularly struck by the opportunity to measure climate adaptation long-term through ND-GAIN. Coming from the climate mitigation world, I miss my tidy metric ton of greenhouse-gas equivalent as a way to measure progress. No neat unit exists for climate adaptation.  But through an index that tracks change over time, you can detect relative shifts in vulnerability and readiness.